An N=1, T=1166 answer to what causes weight gain and weight loss
What I learned from monitoring my fasting, diet, exercise, and sleep for 3+ years
TL;DR: In this post, I share how I lost 15 pounds (≈ 7 kg) in less than four months and kept it off for six months (and counting). I did this by eating only during certain hours of the day, changing what I ate, and exercising more. I also explain how these three things work together to help me lose weight and stay healthy. Moreover, I suggest how other people might benefit from trying something similar.
Imagine skipping breakfast every single day for four and a half years. Sounds crazy, right? Well, that’s exactly what I’ve been doing since my mother-in-law first introduced me to intermittent fasting (or time-restricted eating, as the experts call it).
Intermittent fasting is a popular trend among health enthusiasts who claim it can help you lose weight, boost your metabolism, and prevent diseases. But does it really work, and if it does, is it worth not eating so frequently? Recent medical evidence on this topic seems to contradict popular opinion (see here, here, and here) by pointing out that fasting doesn’t lead to weight loss in the long run.1 Is there an explanation that could reconcile these contradictions?
To get to the bottom of this for myself, I decided to monitor four major health variables every day for over three years: fasting duration, pedometer steps, sleep, and body weight. This post contains a full analysis of the resulting data (data and R code are publicly available here; analysis file is in src/analysis.R). Hopefully it will be clear what has and hasn’t worked for me. And maybe what has worked for me will work for you! But, of course, that’s the trouble with N=1 analyses: it’s impossible to know how they will generalize.
Main findings
It’s possible (and maybe even easy?) to gain weight even while aggressively shortening eating periods! This is the thing that shocked me the most.
I lost about 15 pounds over a 3-4 month interval by combining time-restricted eating, diet, and regular exercise. What you consume during your eating period seems to matter much more than how short your eating period is.
Exercise doesn’t need to be ambitious, high-intensity, or time-consuming to be effective.
Fasting seems to have other benefits aside from weight loss: Since I begin restricting my eating periods every day, I haven’t gotten sick—no flu, no Covid, nothing except for an occasional mild cold—and I’ve generally just felt “better.”2 This video provides some evidence on other health metrics that I can’t measure myself.
It’s a lot of work to maintain a healthy body weight in the world we live in. And odds are that I have a genetic advantage to start with!
Health prescriptions
Based on my experience, it seems that others could benefit from adopting the following behaviors on a consistent basis:
Sustainability is key: find things you like and lean into them. Don’t be afraid to occasionally cheat, but if you cheat too much, then you’ve changed your program.
Walk every day for the equivalent of 1 hour—about 3 miles. It doesn’t need to be in one go, and might even be more beneficial if it’s not all at once.
Pay attention to what you’re eating. Reducing sugar, processed carbohydrates, and seed oils seems to have a high cost-benefit ratio.
It’s not so much “eat less, move more” as it is “eat smart, move smart.” “Smart” here is “sustainable” (see the bullet point above). What isn’t smart is adopting the popular exercise-for-reward mindset. Thinking, “I ran a 5K so now I can enjoy this [food that is objectively bad for me]” is not healthy.
Changing one’s preferences seems to be the only long-term solution. And it’s a massively difficult problem given the social role that food plays throughout our lives. Even if a person decides to adopt a different lifestyle, there will always be social gatherings among family, friends, or coworkers featuring foods that go against that person’s health goals.3
Analysis details
Data
I kept track of my daily fasting duration, weight, steps, and sleep from January 22, 2020 until April 1, 2023 (≈39 months or 1,166 days). Data on fasting, steps, and sleep goes back even further.4
Basic Trends
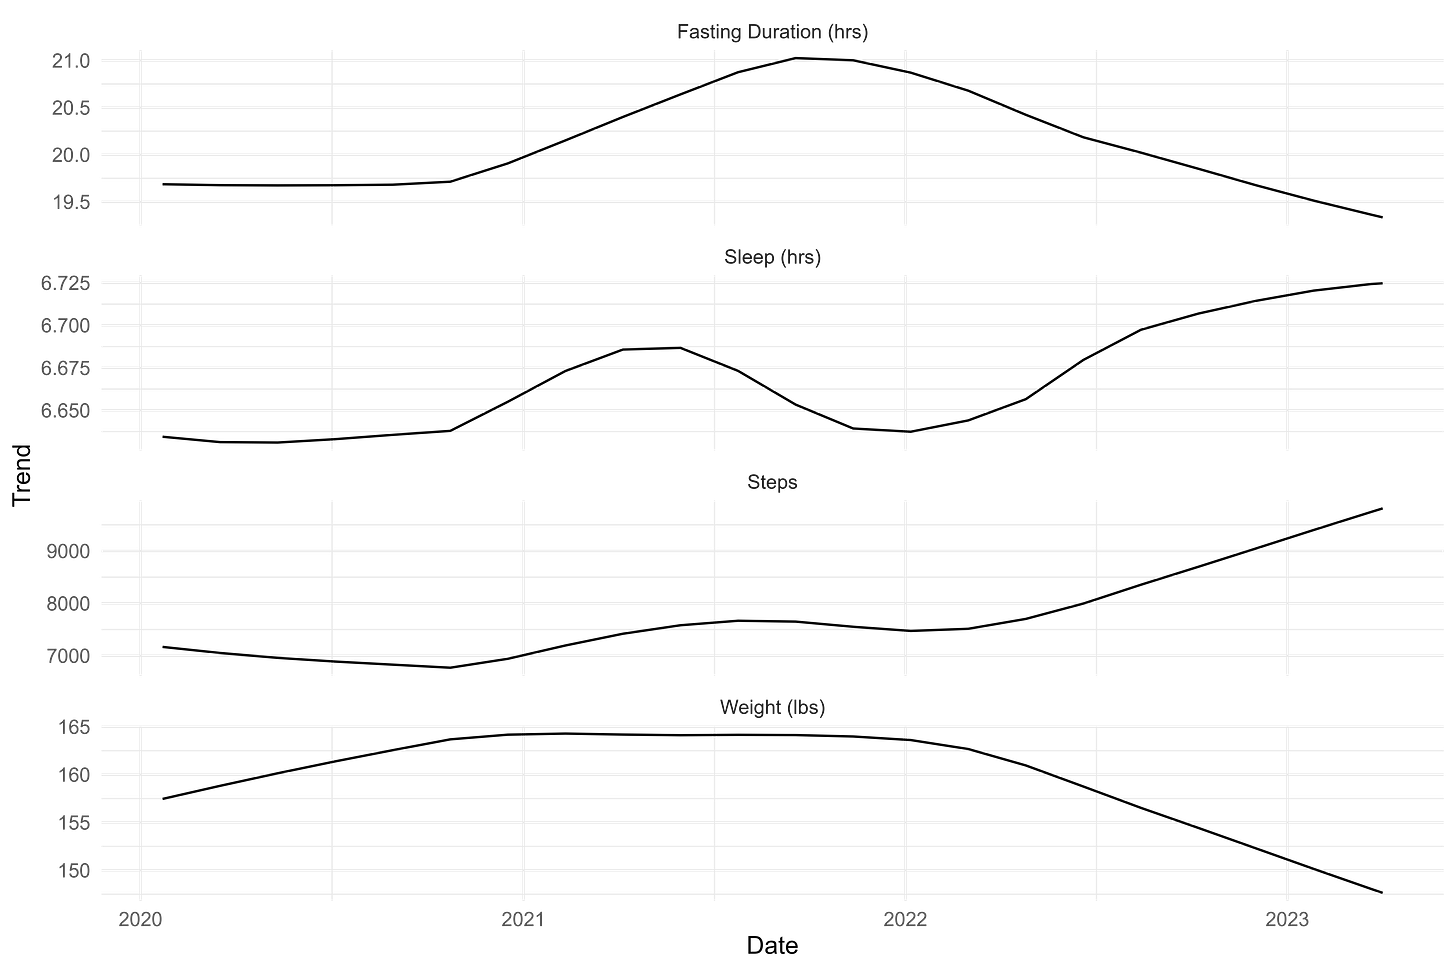
The picture below tells most of the story.5 I’ve consistently fasted for over 19 hours (on average) throughout this period. My sleep hasn’t changed much (deviating by less than 10 minutes). My steps and weight, however, varied quite a bit and are nearly mirror images of one another. When my weight was trending upward during 2020, my steps were trending downward. Then when my weight started plummeting, my steps took off.
Of course, we all know that looking at two trending time series variables is no way to determine causality. In this case, I know that I made significant changes to my diet at the same time I was ramping up my steps.
What changes can account for the observed trends?
I made the following changes after reading the book Two Meals A Day in late July 2022 (see here for more details):
Get at least 7,000 steps each day (about 5 kilometers)
Try to stay active throughout the day by doing “microworkouts” or “movement snacks”
Eliminate or dramatically reduce seed oils and processed carbohydrates (including sugar) from diet
Try to eat more “ancestral foods” like kefir, nuts, eggs, organ meats, etc.
These were on top of things I was already doing that are arguably healthy:
No alcohol or soft drinks
Putting at least 18-22 hours between meals every day
Playing outside with my kids nearly every day
Playing pickup basketball once a week
Beginner-level calisthenics 2x-3x per week
Why wasn’t I seeing more gains before Two Meals A Day? Probably because I was still doing things like eating sugar cookies, donuts, pizza, ice cream, and Frito-Lay products on a regular basis.
Time series regression analysis
I did some time series regression analysis of my weight, using an ADL or “autoregressive distributed lag” model. The results are at the very bottom of this post. Importantly, I used de-trended, seasonally adjusted data as not doing so could result in spurious correlations. Even then, it’s not clear how conclusive the analysis is.
Some takeaways:
body weight has a high amount of autocorrelation (one-day-lag coefficient of 0.68)
steps, sleep, eating window length, long-fasting, traveling, and eating pizza all at some level “Granger cause” weight, but the magnitudes and statistical significance were lower than I would have guessed.
Time series forecast
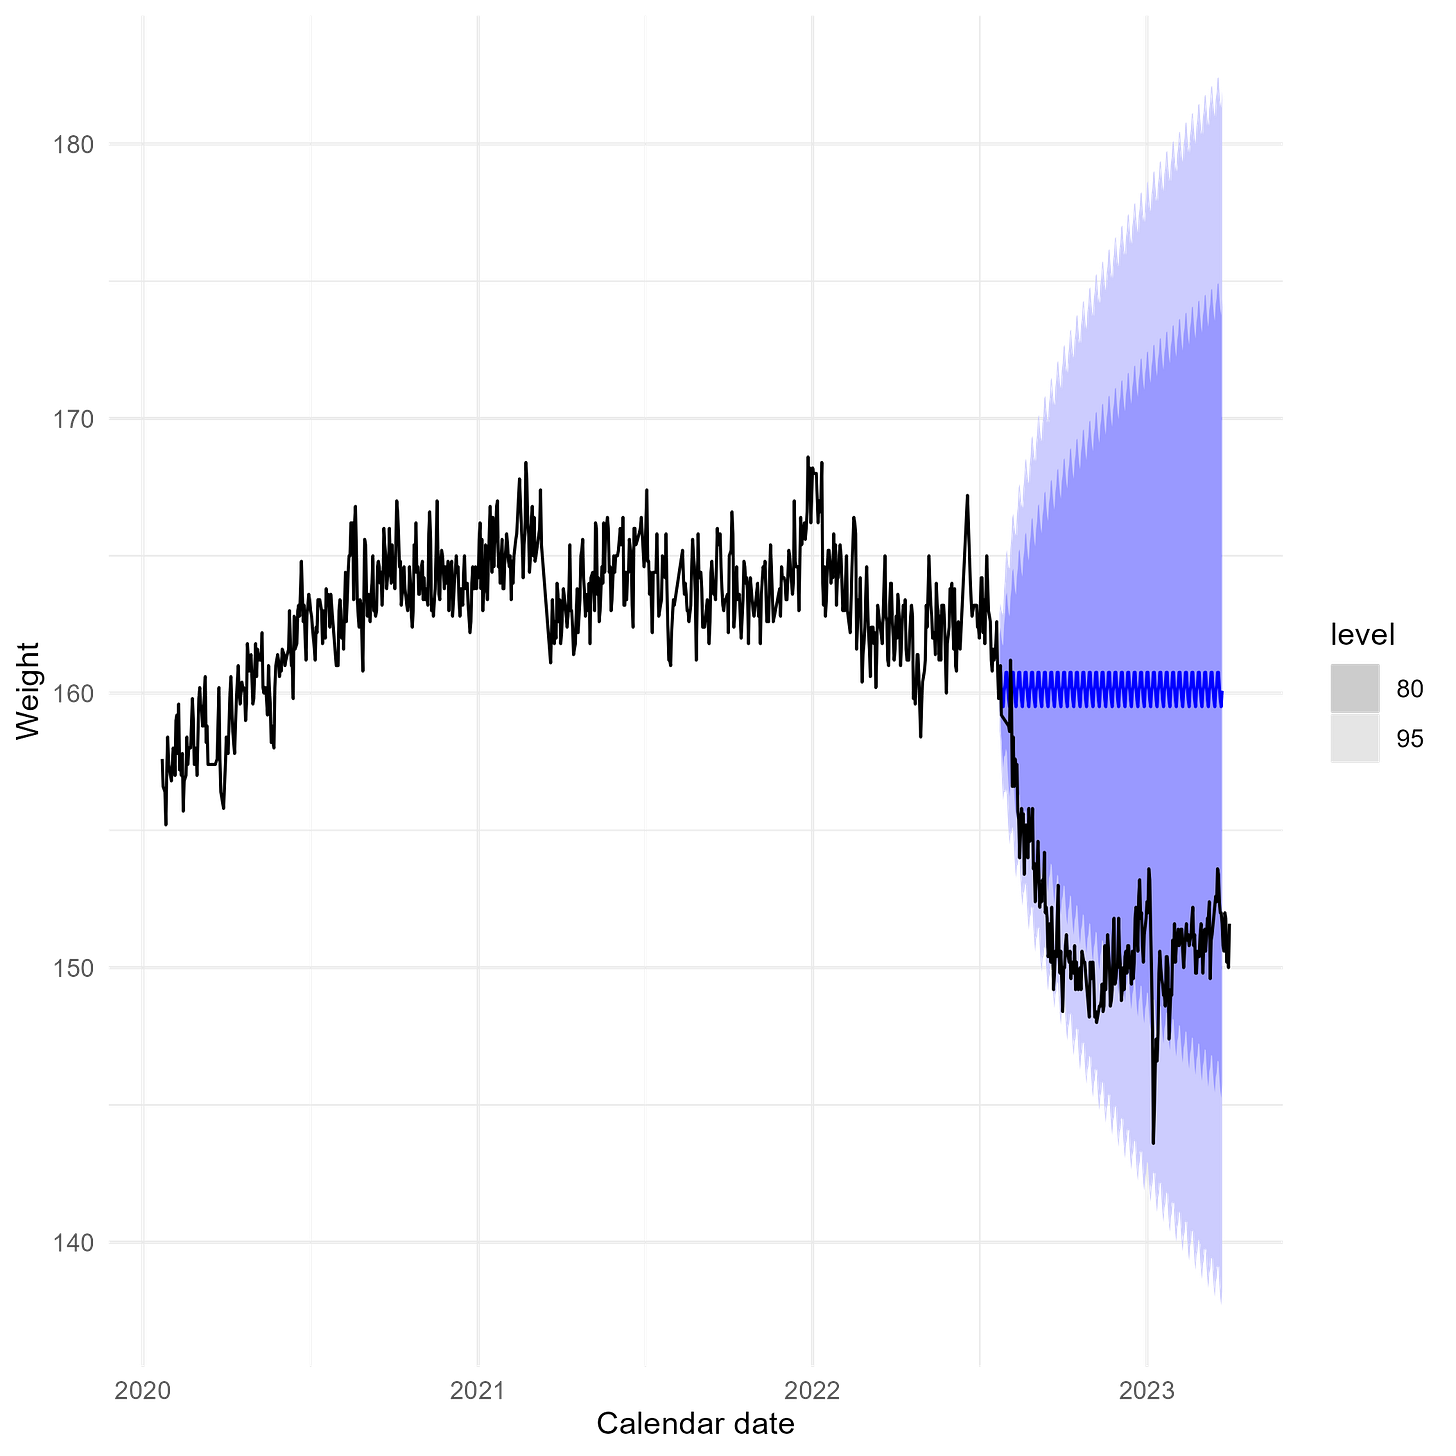
To assess the impact of Two Meals A Day, I did a simple time forecast of my weight from the moment before I began the program. Here’s what it looks like:
While I doubt this forecast would pass muster at a serious academic journal, the basic result is that my weight loss was unlikely to have occurred by chance based on the prior history.6
Where do we go from here?
In this blog post, I’ve shared my personal experience of keeping my weight under control by following some ostensibly simple guidelines. I’ve found what works for me, but will it work for other people? And, if so, will other people be able to continually follow these guidelines? These are key questions.
Obesity is only accelerating worldwide, so it’s important to figure out how to slow its growth. Reducing consumption of processed foods, tightening eating windows, and increasing physical activity have been successful strategies for me to lose weight. But I know it’s not for everyone.
The broader question remains: is there a “shortcut” to staying at a healthy weight that doesn’t involve constant overanalysis of personal behavior? Semaglutide and Wegovy have proven helpful for people already obese, but what about people who are currently at a healthy weight but trying to avoid becoming obese? It seems that there is a tight trade-off between delicious food and overweight or obesity.
There’s also a philosophical question, nicely stated by Scott Alexander: “What do we do if the enemy [causing obesity] is deliciousness itself?” Should we attempt to rid ourselves of all culinary pleasure just to be a little healthier? Would this even be possible given how connected government and agriculture are?
I’m not sure what the answers to these questions are, but I plan to continue following the path I’ve documented here. I also plan to check in from time-to-time to report my progress and anything else I’ve learned. One thing I have noticed is that my food preferences have changed. After separating myself from highly rewarding foods, now I usually feel sick if I deviate from my routine and eat some. I think we as a (U.S.) nation and world can make a lot of progress if we truly stop and think about what our body is telling us when we eat.
References
Here is a list of resources that I’ve found helpful (in no particular order)
The Hungry Brain, by Stephan J. Guyenet Ph.D.
Two Meals a Day, by Mark Sisson and Brad Kearns
Dr. Sten Ekberg’s YouTube channel
Al Kavadlo’s YouTube channel, in particular this video
Strength Side YouTube channel
Appendix
Raw variable graphs
Fasting
Weight
Note: max = 168.6; min = 143.6
Steps
Sleep
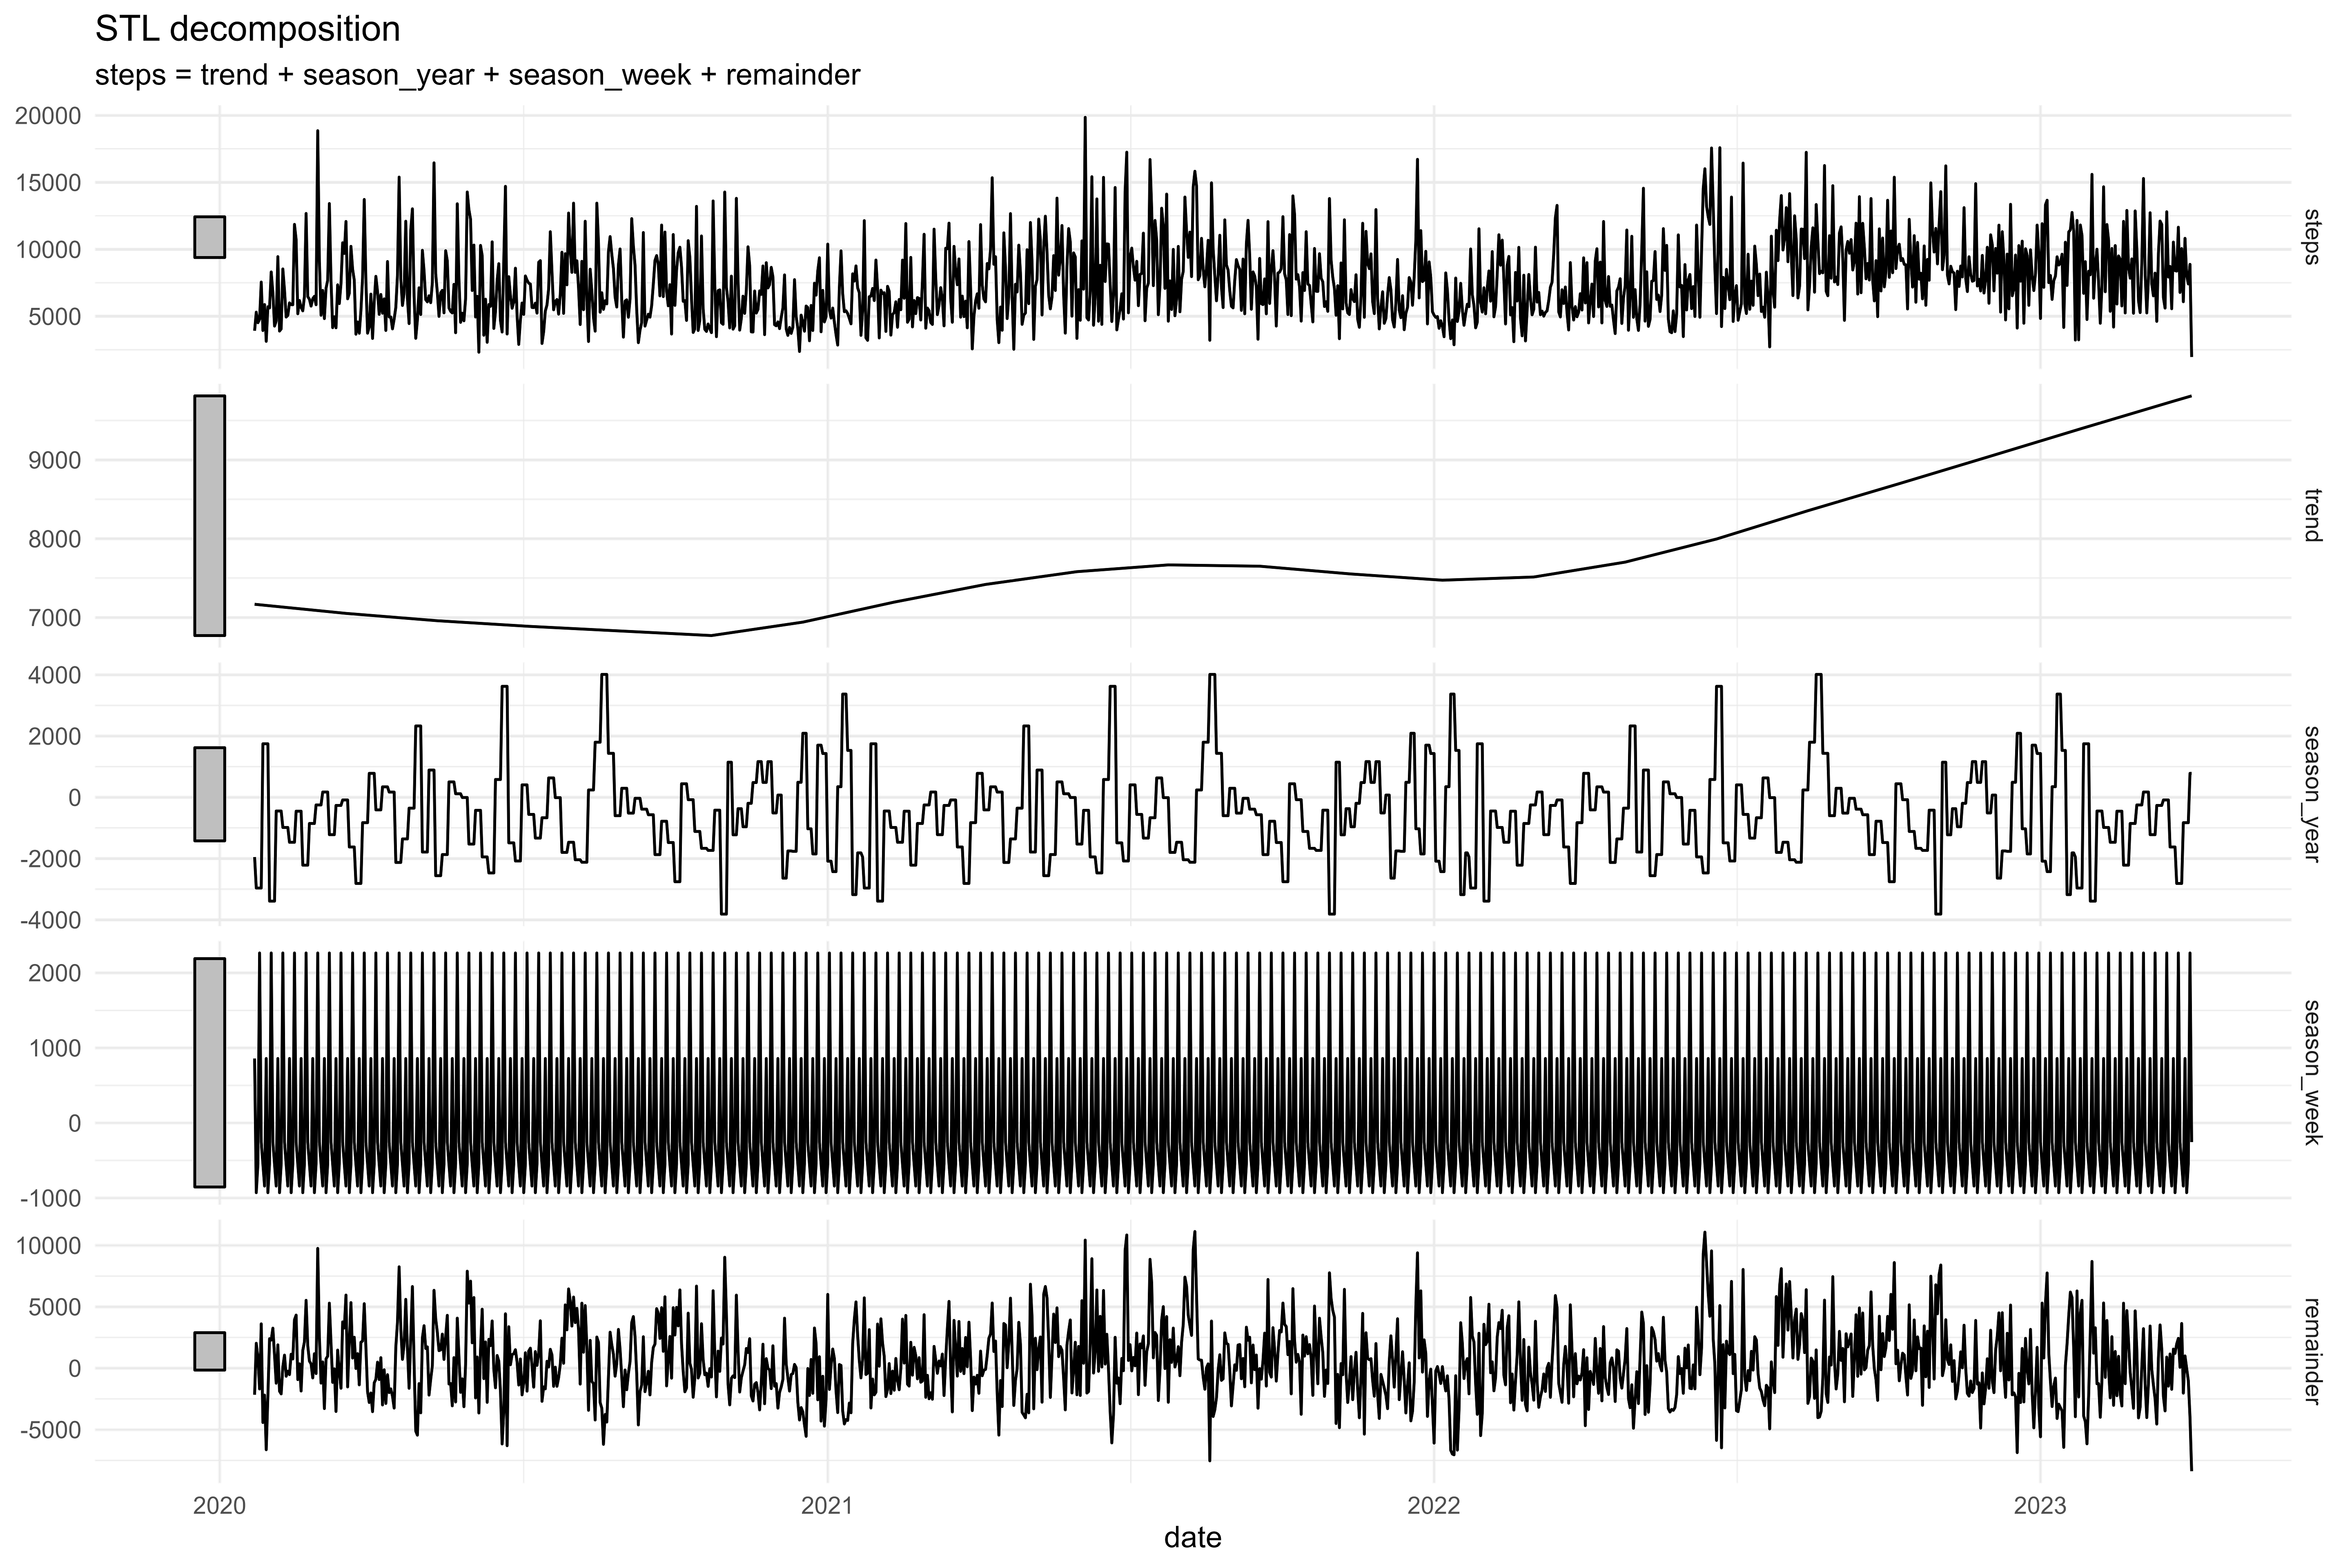
STL decomposition graphs
Below are some graphs of STL decompositions (which are meant to net out trends and seasonality) for the three variables of interest:
Fasting duration
Weight
Steps
Sleep
Time series regression estimates
Coefficients:
                           Estimate Std. Error t value Pr(>|t|)
(Intercept)                0.026470   0.031951   0.828  0.40759
lag(weight_adj)            0.683718   0.030010  22.783  < 2e-16 ***
lag(weight_adj, 2)         0.066959   0.036294   1.845  0.06532 .
lag(weight_adj, 3)         0.060335   0.036210   1.666  0.09594 .
lag(weight_adj, 4)        -0.013098   0.036271  -0.361  0.71808
lag(weight_adj, 5)         0.038685   0.036184   1.069  0.28524
lag(weight_adj, 6)         0.019919   0.035834   0.556  0.57842
lag(weight_adj, 7)         0.084189   0.029228   2.880  0.00405 **
lag(steps_adj)             0.027554   0.009965   2.765  0.00579 **
lag(steps_adj, 2)          0.004989   0.010187   0.490  0.62443
lag(steps_adj, 3)         -0.007869   0.010180  -0.773  0.43966
lag(steps_adj, 4)         -0.005481   0.010207  -0.537  0.59138
lag(steps_adj, 5)          0.001039   0.010239   0.101  0.91917
lag(steps_adj, 6)         -0.020589   0.010199  -2.019  0.04375 *
lag(steps_adj, 7)         -0.007502   0.009963  -0.753  0.45161
lag(sleep_adj)             0.118892   0.040923   2.905  0.00374 **
lag(sleep_adj, 2)          0.066188   0.040890   1.619  0.10580
lag(sleep_adj, 3)          0.053902   0.040978   1.315  0.18865
lag(sleep_adj, 4)          0.024485   0.041068   0.596  0.55116
lag(sleep_adj, 5)          0.044860   0.041068   1.092  0.27492
lag(sleep_adj, 6)         -0.042833   0.041056  -1.043  0.29704
lag(sleep_adj, 7)          0.057118   0.040998   1.393  0.16384
lag(fasting_adj)           0.002068   0.010871   0.190  0.84919
lag(fasting_adj, 2)       -0.051258   0.011196  -4.578 5.22e-06 ***
lag(fasting_adj, 3)        0.014489   0.011374   1.274  0.20298
lag(fasting_adj, 4)       -0.004086   0.011380  -0.359  0.71962
lag(fasting_adj, 5)       -0.003944   0.011321  -0.348  0.72760
lag(fasting_adj, 6)        0.014862   0.011199   1.327  0.18477
lag(fasting_adj, 7)        0.014215   0.010685   1.330  0.18366
lag(long_fast_adj)TRUE    -2.410448   0.509853  -4.728 2.56e-06 ***
lag(long_fast_adj, 2)TRUE  1.548376   0.527838   2.933  0.00342 **
lag(long_fast_adj, 3)TRUE -0.823346   0.529265  -1.556  0.12008
lag(long_fast_adj, 4)TRUE  0.152474   0.531785   0.287  0.77438
lag(long_fast_adj, 5)TRUE  0.553852   0.531203   1.043  0.29734
lag(long_fast_adj, 6)TRUE -0.389027   0.527677  -0.737  0.46113
lag(long_fast_adj, 7)TRUE -0.517277   0.518252  -0.998  0.31844
lag(traveling)TRUE        -0.448206   0.192564  -2.328  0.02011 *
lag(traveling, 2)TRUE      0.211959   0.256076   0.828  0.40801
lag(traveling, 3)TRUE     -0.182161   0.257267  -0.708  0.47905
lag(traveling, 4)TRUE      0.354994   0.257049   1.381  0.16755
lag(traveling, 5)TRUE     -0.098319   0.257247  -0.382  0.70239
lag(traveling, 6)TRUE      0.240977   0.258143   0.934  0.35076
lag(traveling, 7)TRUE     -0.181877   0.193124  -0.942  0.34652
lag(ate_pizza)TRUE         0.130628   0.178043   0.734  0.46329
lag(ate_pizza, 2)TRUE      0.165101   0.178906   0.923  0.35629
lag(ate_pizza, 3)TRUE     -0.101685   0.179490  -0.567  0.57115
lag(ate_pizza, 4)TRUE      0.195732   0.179730   1.089  0.27637
lag(ate_pizza, 5)TRUE      0.432669   0.179346   2.412  0.01601 *
lag(ate_pizza, 6)TRUE     -0.222697   0.179327  -1.242  0.21455
lag(ate_pizza, 7)TRUE     -0.305294   0.178336  -1.712  0.08719 .
---
Signif. codes:  0 ‘***’ 0.001 ‘**’ 0.01 ‘*’ 0.05 ‘.’ 0.1 ‘ ’ 1

Residual standard error: 0.9337 on 1109 degrees of freedom
  (7 observations deleted due to missingness)
Multiple R-squared:  0.8069,	Adjusted R-squared:  0.7984
F-statistic: 94.59 on 49 and 1109 DF, p-value: < 2.2e-16I conjecture that the main reason these studies show null effects is because fasting needs to be combined with a change in diet in order to produce results. As my data clearly shows, I was able to put on (and maintain for over 1 year) 5-7 pounds while eating in a <6 hour window every day.
So, rather than designing an experiment with “calorie restriction” as the control group and “fasting” as the treatment group [with no dietary restrictions on either group], it would be better to instead have the following design:
Control Group 1: calorie restriction but no dietary restriction
Control Group 2: dietary restriction but no calorie restriction
Treatment Group: dietary restriction and time-restricted eating
OK, there was that time when I ate some food at a church potluck and got mild food poisoning, but I’m not counting that because it came and went within 36 hours.
A recent personal example of this: being invited to a Thanksgiving event where there was a buffet of desserts. I fully participated in the gathering, but didn’t feel very good the next day.
The real problem here is for a person who frequently attends social gatherings like these. It’s difficult or impossible to “return to normal” if your “normal” is putting yourself in social situations that feature unhealthy foods. Especially if your family or cultural tradition centers on those kinds of foods.
The main limiting variable here is weight. I began fasting in late November 2018, and I have steps and sleep data for nearly eight years. But I didn’t begin tracking fasting duration until November 2019 and didn’t track weight until January 2020.
For those interested, these trends are the “trend” component from an STL decomposition, i.e. “Seasonal and Trend decomposition using Loess.” I’m no expert, but my understanding is that this decomposition separates out the seasonal components of a time series and recovers the trend using Loess (local polynomial regression), which allows for basically non-parametric trends.
In technical terms, the realized time series after starting the program is often outside of the 80% forecast interval, meaning that there is only a 100% - 80% = 20% probability that the actual realization would fall outside the interval. In other words, my observed weight loss trajectory was unlikely to have occurred by chance.


"Organ meats" jumped out at me. Many organ meats contain high amounts of phosphatidylserine, which some have reported to cause weight loss.